- College Service Area
- 2024-25 Student & Service Area Demographics
- 2024-25 Enrollment
- 2024-25 Demographics: Selected Populations
- 2024-25 Completions
College Service Area
Grays Harbor College was founded in 1930, and serves a two-county district comprised of Grays Harbor and Pacific counties in southwestern Washington. Within this 3,000-square-mile district, numerous rural communities combine for a total population of approximately 100,147 people. For comparison, the population of the combined Olympia, Tumwater, & Lacey metropolitan area was 134,481 as of the 2020 Census. Grays Harbor College has campuses in Aberdeen, Raymond, and Ilwaco, and provides educational opportunities at Stafford Creek Corrections Center (SCCC), which is located in the service area.
Students at SCCC are able to complete their high school equivalency and earn certificates and associate degrees in various fields.
Grays Harbor and Pacific counties are mostly rural and traditionally have relied heavily on the fishing and timber industries. The region has been heavily affected by the decline of these industries and the recent recession.
Grays Harbor and Pacific counties are also home to several Native American nations, including the Quinault, Chehalis, Shoalwater Bay, and Chinook Indian Nations. Many members of the Grays Harbor and Pacific County communities are employed by Nation-owned businesses (GHC’s Land Ackknowledgement Statement).
2024-25 Student and Service Area Demographics
Definitions are below the table.
| 2024-25 Academic Year | All GHC Students | State-Funded Only | Running Start Only | GHC Service Area of Grays Harbor and Pacific Counties |
|---|---|---|---|---|
| Unique Headcount | 2,992 | 1,884 | 535 | 100,147 |
| % Female | 48% | 58% | 64% | 49% |
| % HU Students of Color | 37% | 39% | 30% | 16% |
| Median Age | 26 | 26 | 17 | 45 (GH)/55 (P) |
| % Attending Full Time (12+ credits) | 42% | 43% | 63% | n/a |
| % Receiving Need-Based Aid | n/a | 60% | n/a | n/a |
| % Receiving Pell Grant | n/a | 34% | n/a | n/a |
Demographic Definitions
- All Students includes all students who attend Grays Harbor college. This includes Running Start (11th and 12th grade students attending college for both High School and College Credit), English Language Learners (ELA), adult students earning a high school diploma or equivalency (Basic Education for Adults (BEdA) or Transitions), students in college level classes for skills training or to pursue an Associate or Bachelor of Applied Science degree, community/continuing education, and education provided through the Stafford Creek Corrections Center. For this report, students are grouped into broad categories of: Running Start, Stafford Creek, Continuing Education (not currently reported), and State-Funded students. State-Funded includes ELA, High-School Equivalency, and college-level students who are not in one of the previous categories.
- HU Students of Color (HU-SoC) Historically Underserved Students of Color is a demographic grouping used by the WA State Board for Community and Technical Colleges (WA SBCTC) to measure equity gaps. It includes individuals who are at least one of: Black or African American, Hispanic or Latino, Native American or Alaska Native, Native Hawaiian or Other Pacific Islander.
- Full-Time is defined as taking 12 or more college-level credits in a given quarter. However, a student needs to take 15 credits per quarter to finish an Associate degree within 2 years.
2024-25 Demographics (Selected Populations)
The demographics in this section reflect all unique State-Funded and Running Start Students from 2024-25. State-Funded includes ELA, Transitions, Developmental Ed (Pre-College), and College-Level Courses.
Unique Students by Student Type

By Gender
- % Female: 60%
- % Male: 40%
% Full/Part-Time
Full-time students are those taking 12 or more credits in a single quarter. Based on first full quarter of attendance (fall, winter, spring) or summer if only attended during summer.
- Full Time: 58%
- Part-Time: 42%
By Age Group
| Age Group | State + Running Start | State Alone |
|---|---|---|
| 19 & Under | 37% | 19% |
| 20-24 | 19% | 24% |
| 25-29 | 11% | 14% |
| 30-39 | 18% | 23% |
| 40 & Above | 15% | 19% |
Pell Grant Recipient
- % Received Pell: 34%
Note: The denominator for Received Pell only includes State-Funded students. Running Start students are not eligible for Pell Grants.
Historically Underserved Students of Color
- % Historically Underserved Students of Color: 37%
Historically Underserved Students of Color include American Indian / Alaska Native, Black or African American, Latino/Hispanic, Native Hawaiian and other Pacific Islanders, and students reporting two or more races, where one of the races is in that list.
By Race/Ethnicity
| Race Ethnicity | % of Unique State Funded + Running Start Students |
|---|---|
| American Indian/Alaska Native | 4.5% |
| Asian | 1.8% |
| Black or African American | 1.7% |
| Latino/Hispanic | 24.5% |
| Pacific Islander | 0.3% |
| Race/Ethnicity Unknown | 3.1% |
| Two or more groups | 7.6% |
| White | 56.3% |
2024-25 Enrollment
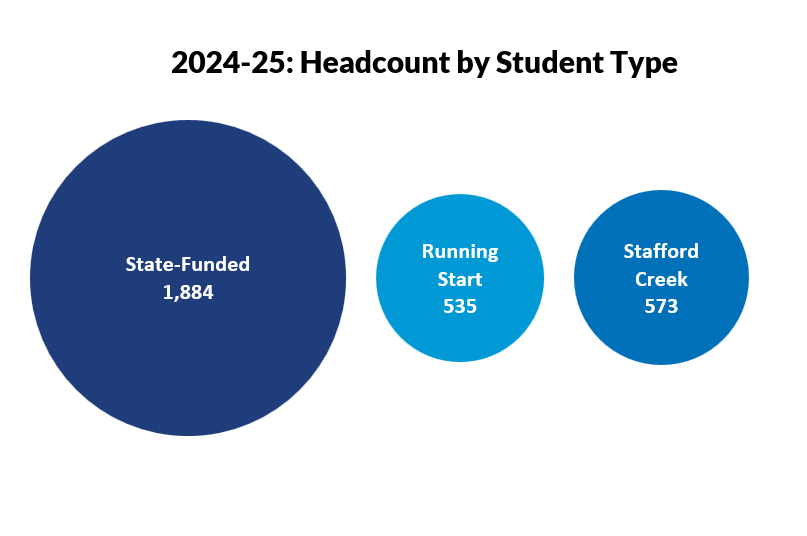
In addition to college-level certificates, associate degrees, and bachelor of applied science degrees, GHC provides contract training, continuing and community education, and education at the Stafford Creek Corrections Center. The following table counts each student once, and shows the breakout of enrollment across the types of students that GHC serves.
| 2024-25 Cohort | Unique Students | Annual FTES | % of Annual FTES | Median Age |
|---|---|---|---|---|
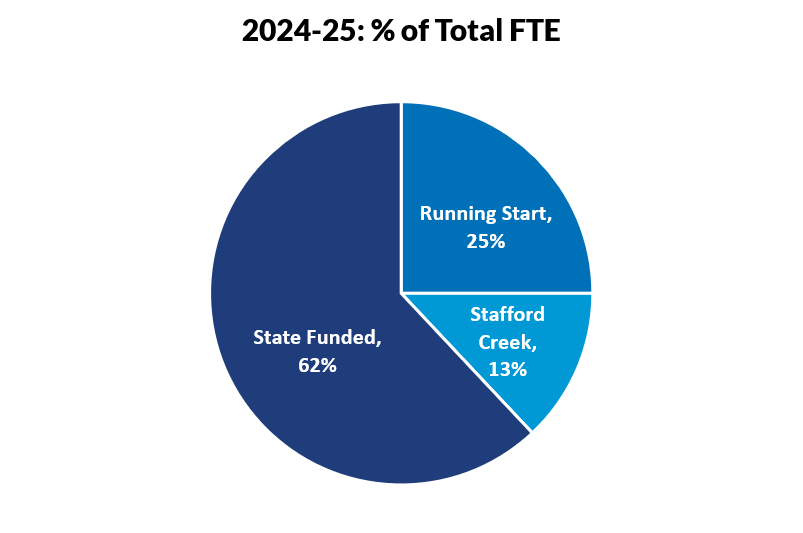
| State-Funded | 1,884 | 1,071 | 62% | 26 |
| Running Start | 535 | 437 | 25% | 17 |
| Stafford Creek | 573 | 220 | 13% | 39 |
| Grand Total | 2,992 | 1,728 | 100.0% | 26 |
FTE stands for Full-Time Equivalency, and is the equivalent of 45 credits over the course of an academic year. An associate degree is usually around 90 credits. To complete an associate degree in two years, a student would need to complete 15 credits per quarter, or 45 credits each year.
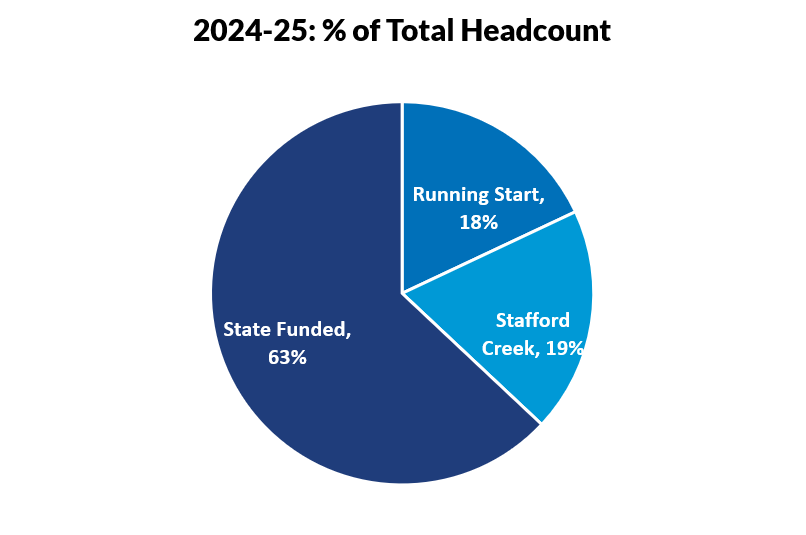
For the following charts, figures have been rounded, and may not add to 100%.
% Of Annual Headcount (Unique Students) by Student Type

% of Annual FTE by Student Type

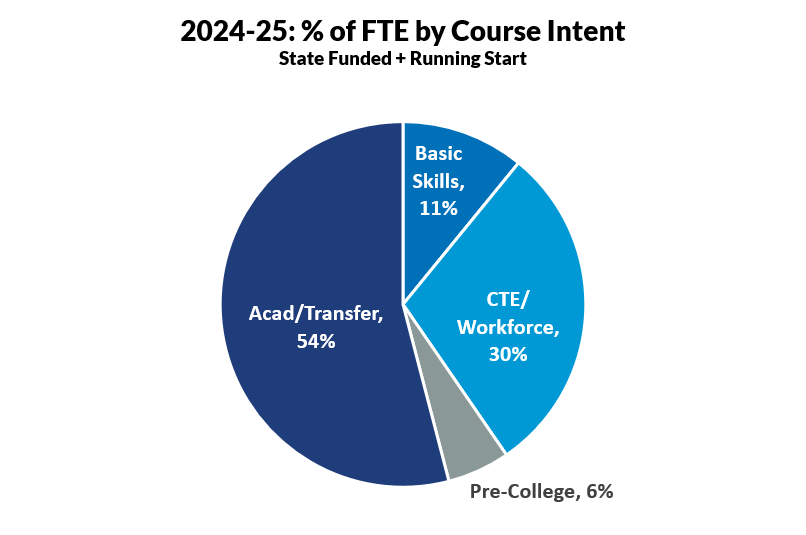
FTE By Course Intent: Selected populations
The following pie chart details enrollments for State Funded and Running Start students by the intent of the course: Basic Education for Adults (includes ELA), Pre-College, Transfer courses, and Workforce/Vocational courses. This chart only includes enrollments for State Funded and Running Start students.

2024-25 Completions
The number of completions by Academic Year. The count is the number of degrees earned, and not number of students. Some students will have earned more than one degree and will be represented more than once in the count.
| Degree Type | 2021-22 | 2022-23 | 2023-24 | 2024-25 |
|---|---|---|---|---|
| High school/GED | 79 | 122 | 187 | 137 |
| Certificate: <45 Credits | 48 | 72 | 76 | 96 |
| Certificate: 45+ Credits | 58 | 39 | 19 | 19 |
| Associates in Applied Science | 75 | 67 | 44 | 30 |
| Associates in Applied Science, Transfer | 7 | 9 | 4 | 6 |
| Associates of Arts DTA | 183 | 218 | 203 | 208 |
| Associates of Science | 11 | 9 | 13 | 9 |
| Associates of Science DTA | 5 | 7 | 8 | 5 |
| Associates of Technology | 13 | 12 | 11 | 9 |
| Bachelors of Applied Science | 27 | 28 | 15 | 22 |
| Total Awards | 506 | 583 | 580 | 541 |
DTA means “Direct Transfer Agreement,” these degrees have articulation agreements with certain 4-year colleges where students can transfer in as a junior.
SBCTC provides dashboards for tracking enrollment, award completion and other student progress measures, faculty and staff, and financial information for all colleges in the WA Community and Technical College system.
In order to productively engage with equity, diversity and inclusion (EDI) issues, it is important to have a shared understanding of the language that we use. The Diversity Advisory Committee developed a glossary of Diversity Definitions during the 2021 academic year. To access this glossary, please visit https://www.ghc.edu/edi/diversity-definitions.
